When you rely on measurements to understand your organization, you need broad measurements. Missing data can’t be analyzed, which means conclusions could be wrong.
Business Performance Relies on Network Performance
That’s why organizations need to use DNS, DHCP, and IP address usage data in partnership with network performance data. Including them in your overall performance metrics evaluation gives you the equivalent of stereoscopic vision.
Management and monitoring of IP addresses and DNS names on your network supercharge network performance monitoring. Together they reduce downtime and speed recovery from incidents..

Strategic Partnership Between Provision’s DDI and Network Performance Monitoring
Monitoring starts with data. You set out your desired state in your authoritative database: ProVision. It includes how you use IP addresses and the DNS names for services and clients. Then you monitor your network. You find the delta between the two and adjust so that reality matches your database’s source of truth.
This supercharges your Network Performance Management (NPM).
NPM is vital. Without it you can’t understand how each part of your network performs. DNS, DHCP, and IP Address Management (DDI) complete the picture. They tell you about users, adding value to network segment performance monitoring.
Traditional NPM tools track important network metrics:
- Packet loss
- Latency
- Traffic throughput
When you add in DDI metrics you see an extra level of detail:
- IP address pool consumption
- Lease patterns
- Naming patterns
The NPM measures tell you how healthy your network is. DDI metrics quickly inform your understanding of incidents, so you can resolve them. And they give you the capacity planning insights you need to make sure you have the resources for tomorrow.
What is DDI?
DDI is a key component of measuring, reporting, and managing the three key elements configured on your network:
- DNS: the system for naming the devices on your network
- DHCP: the system that centralizes the assignment of IP addresses to devices on your network
- IPAM: the system for managing your organization’s IP addresses
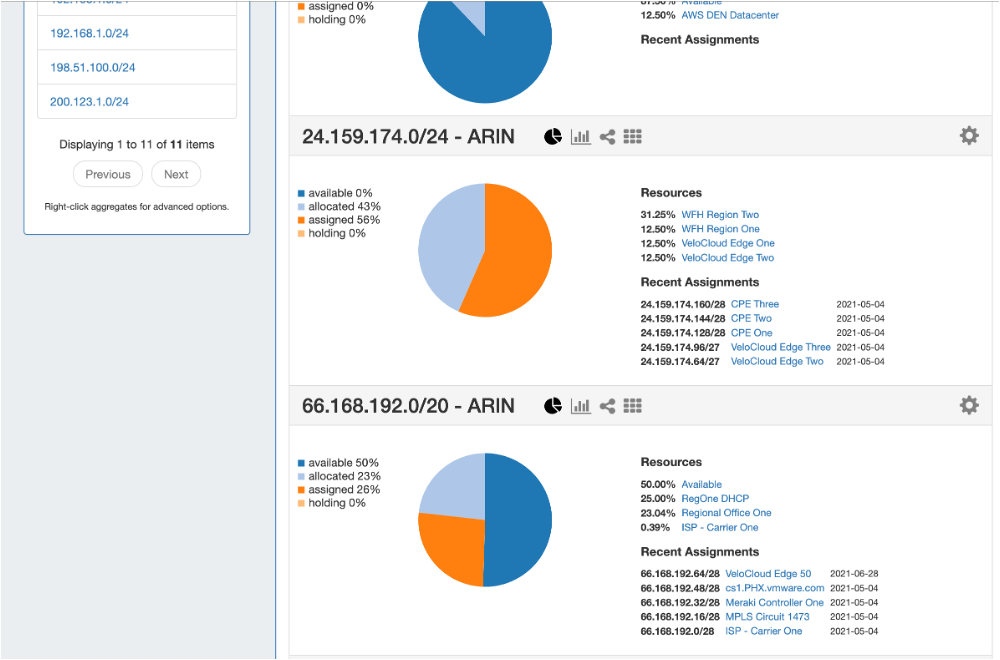
ProVision’s overview shows how each of your IP address blocks is used.
ProVision’s DDI Enhances NPM Giving You Stereoscopic Vision
Your NPM tells you about current and past network performance. It helps you troubleshoot issues happening right now and can show you what has happened in the past. It help you understand patterns. It will help you understand your network’s health and help you plan for the future. For instance, if you see that a link is at 80 percent of its capacity you’ll know to upgrade it.
ProVision helps you understand why.
ProVision’s IPAM is the authoritative source of truth for IP addressing on your organization’s network. It maintains a continuously updated database of of IP addresses. It knows how your network is segmented and you can configure its database with all the different kinds of resources you assign IP addresses to. That metadata will add context to your NPM’s monitoring reports.
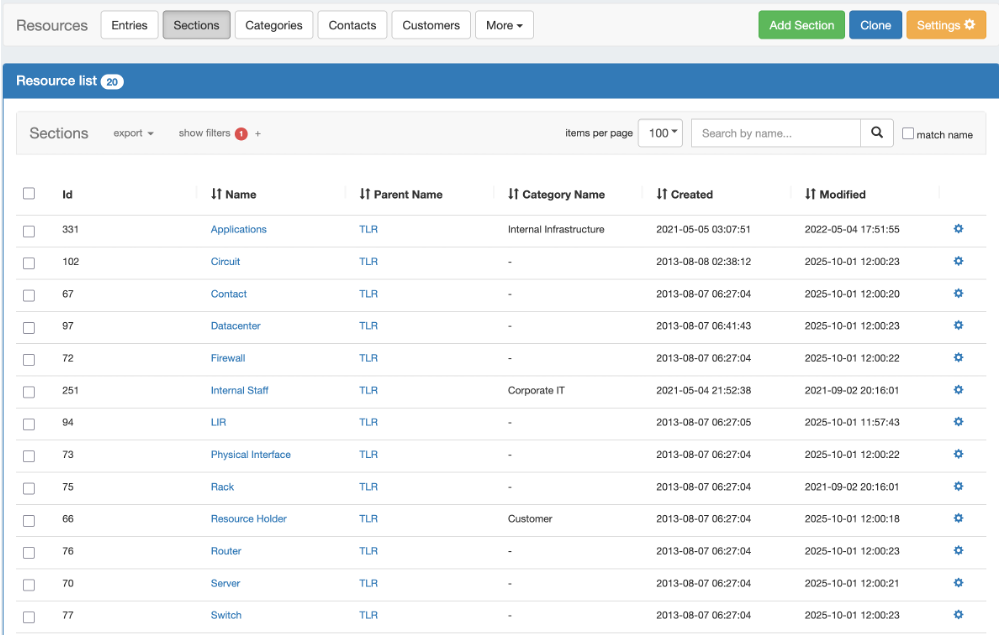
ProVision’s database can be configured with the metadata you assign to IP addresses and DNS records.
And for each subnet or address pool it knows what is assigned and what is available. You can always get answer for questions like: When was it last assigned? To whom? For how long? When was it reclaimed?
In partnership with your DHCP service it makes sure that there aren’t IP address conflicts. And it monitors the life cycle of every IP address and your network. If an unassigned IP address appears on your network, ProVision will let your team know
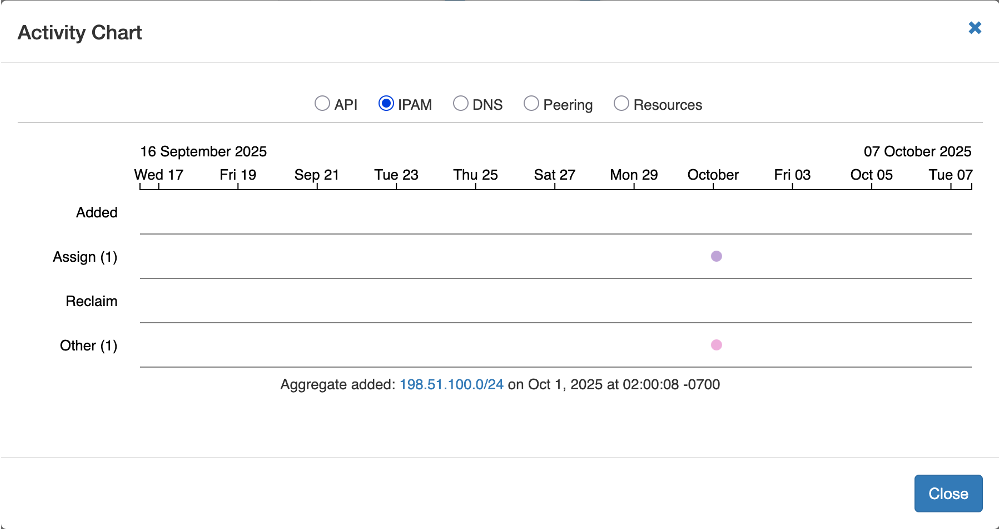
ProVision showing activity events on a timeline.
ProVision knows all these things and more. It maintains statistical data you can use to plan for the future. It’s a key component of capacity planning.
So, while your NPM is measuring the health of traffic on your network, ProVision measures the state of the infrastructure services that direct traffic.
Your network could have no packet loss and low latency. It all looks good until you realize that a stale DNS record means there’s missing traffic. Or a DHCP error means the target device doesn’t know its address. Or a pool of addresses is empty.
When you partner ProVision and NPM you get a complete picture of network health.
Key ProVision DDI Metrics to Get More From NPM
ProVision gives you seven key metrics that will supercharge what you get from your NPM.
- Subnet utilization: How much address space is used in each subnet? When you know this you can expand capacity before you run out. Or you can reclaim addresses to replenish the pool before it runs out. And in multi-cloud and virtualized environments you can combine this metric with cloud specific metrics, like PercentAllocated and PercentAssigned. Together, they will provide greater insight into how IP addresses and other costs are being consumed or delegated.
- IP allocation and reclamation rates: Measure the churn rate for IP addresses. If you’re handing out addresses but not getting them back as fast as your expected then that could indicate abandoned devices. This is vital for understanding costs associated with ephemeral workloads in cloud and containerized environments.
- DNS resolution success and failure: When you know which DNS queries are failing you have a lead on services that are inaccessible to users. Your NPM might show you a normally working network but your DDI can show you a service users can’t access.
- IP address conflict rate: IP address conflicts often mean a failure in the application of network management policy. Sometimes they indicate rogue devices. When ProVision shows you address conflicts you can quickly restore network security.
- DHCP lease occupancy and renewal patterns: The IP address lease renewal pattern should be predictable. Unusual churn rates could indicate rogue devices on your network or drift from centralized configuration management.
- Scan coverage: ProVision scans your network to show you what is real versus what is registered in your database. The scan rate shows you the proportion of your network that isn’t regularly scanned. If the percentage is low your live network might be out of sync with your ProVision’s database.
- Unauthorized allocations and rogue devices: Unauthorized IP addresses on the network – those without a formal lease – could indicate malicious devices bypassing DHCP. They also often indicate “shadow IT” systems. Whichever it is, you want to know about them and either stop those devices or bring them into compliance with policy.
When you review these metrics you’re getting insights that traffic-based monitoring alone cannot deliver. You can correlate both sources of data to gain a better understanding of what’s happening on your network.
NPM can tell you that something is wrong. ProVision gives you the context that will explain what is wrong and why.
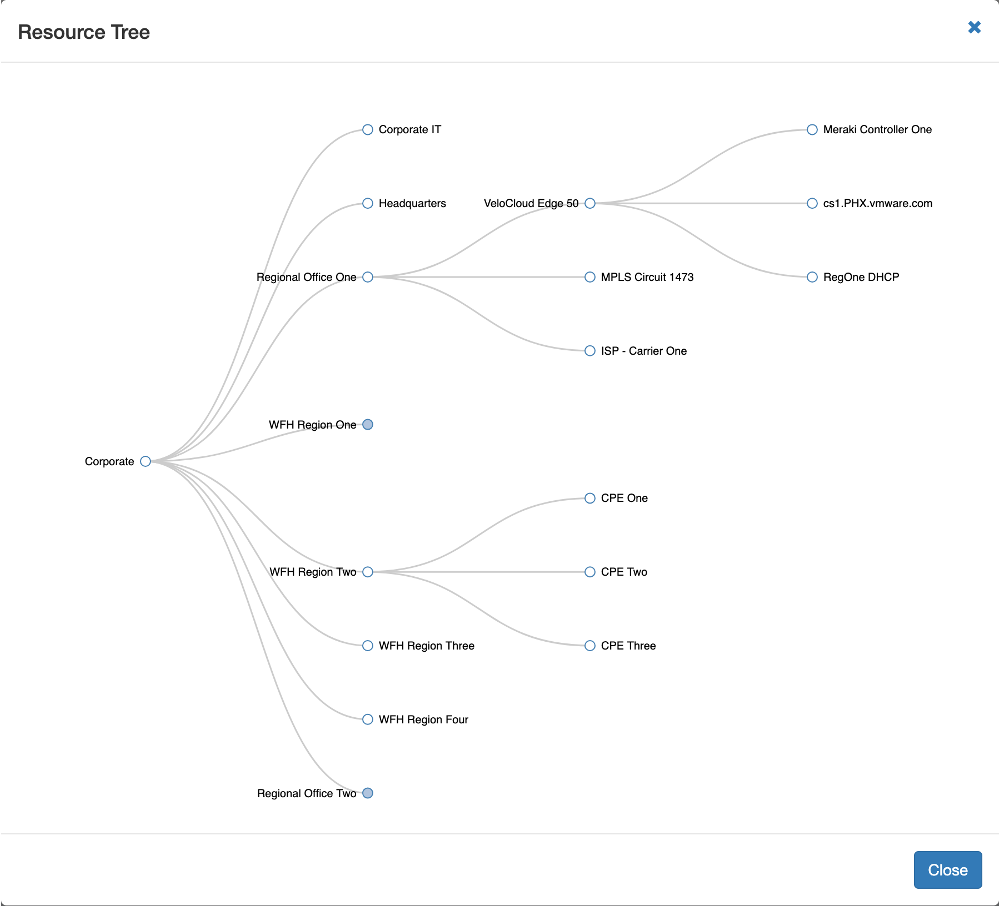
ProVision’s view of a network’s hierarchy and resource tree.
For instance, an NPM can show you that one of your network links is seeing higher traffic than usual. When you overlay ProVision’s data you’ll know which applications, departments, or tenants are responsible for the traffic. This can help your team resolve problems faster and deliver the insights needed for root cause analysis.
Proactive ProVision: Thresholds and Monitoring
When you connect alerts to workflows you can initiate the processes to fix problems before they happen. That means preventing downtime and emergency intervention.
For instance, you can trigger an alert when 80 percent of IP addresses in a subnet are used. That alert can start the process to reclaim addresses assigned to abandoned services, or to expand the address pool. Similarly, a spike in address churn could trigger an alert to your security team, so they can investigate for rogue or misconfigured devices.
ProVision’s Dashboard Visualizes DDI Data
Good systems don’t just give you text and tables. They visualize the data so you can see trends and changes. ProVision’s default dashboard visualizations can be configured to match your organization’s needs.
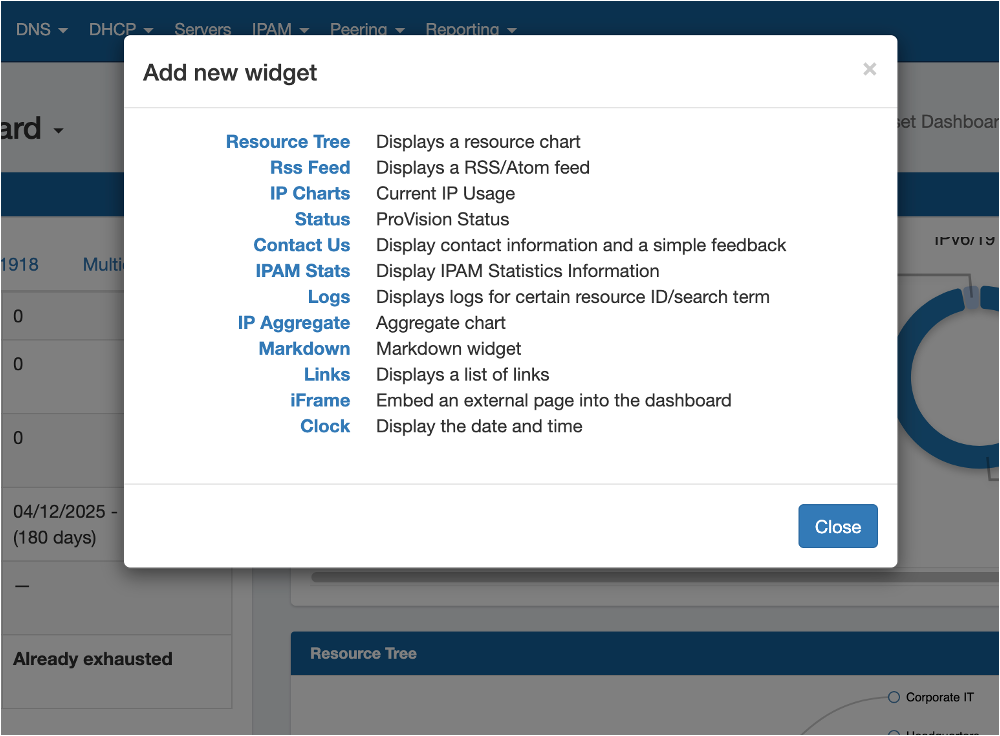
ProVision’s dashboard view can be configured to include external pages as well as DDI visualizations.
When you have good visualizations you can easily compare usage between tenants and anticipate where capacity upgrades are needed. Organizations whose DDI systems don’t provide dynamic visualizations have to rely on static reports. But it’s harder for an executive to understand charts from different pages of a report than to show them side by side, or even overlayed on each other.
Your IPAM oberservability should include:
- Capacity planning dashboard: Knowing which subnets are approaching capacity and those rarely even half used lets to avoid service outages by rearranging IP addresses.
- Multi-tenant health dashboard: Knowing which tenants or departments use more resources gives you insight into why the differences exist. Ten you can plan for the future.
- DNS and DHCP service maps: When you cxan see service level performance it is easier to understand. Visualizations will let you teams pick out the services with unusual address behavior or resolution problems. Then they can quickly fix them.
Using ProVision to Deliver Networking Best Practices
You have policies for compliance and security. You train your people and vet your customers. But when you have a DDI your can enforce policy and prove your compliance with audit requirements. You have an audit log showing performance.
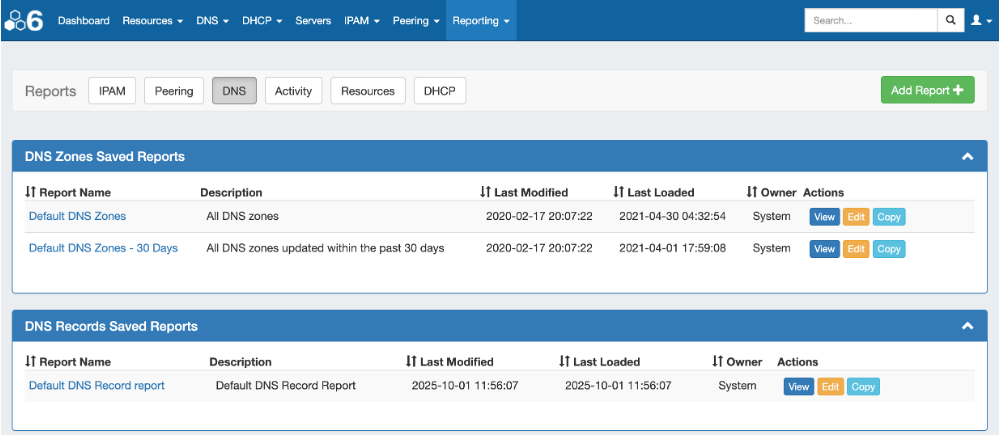
ProVision delivers reports showing an audit trail of changes.
Integrating ProVision’s IPAM monitoring, centralized DHCP, and monitored DNS resolution gives you tools that enhance your security and compliance posture. You can detect issues in real time, correlate them with NPM data – like latency and throughput – and make your your organization’s existing infrastructure more effectice.